
Gasoline prices are highly volatile and vary across regions. While retail prices are visible to consumers, the factors that determine them are less apparent. Crude oil prices are the major driver of gasoline prices (see Figure 1); however, other factors also influence the final price at the pump.
Figure 1 – Crude Oil Benchmarks and Average Retail Gasoline Price in Canada, Monthly, January 2006 to June 2026 (constant 2026 dollars)
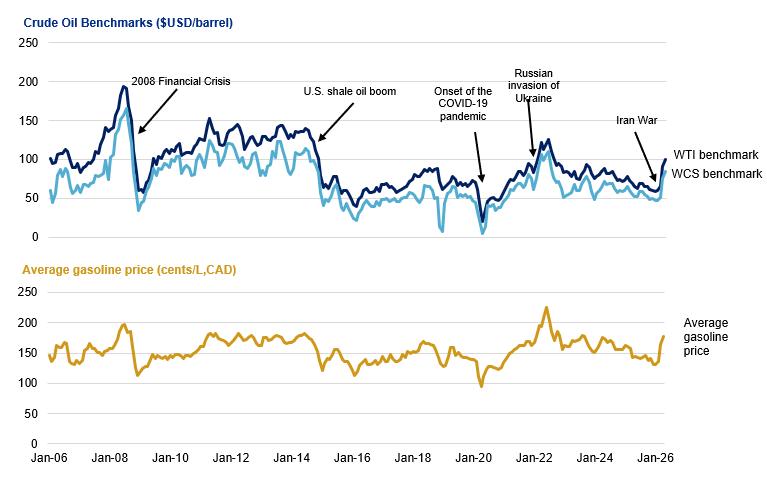
Note: Western Canadian Select (WCS) is a benchmark price for heavy crude oil produced in Western Canada, while West Texas Intermediate (WTI) is the primary North American benchmark for light crude oil. Values are expressed in constant 2026 dollars using the average Consumer Price Index for 2026 (January to June).
Sources: Figure prepared by the Library of Parliament using data obtained from Statistics Canada, “Table 18-10-0001-01: Monthly average retail prices for gasoline and fuel oil, by geography,” Database, accessed 23 July 2026; Statistics Canada, “Table 18-10-0004-01: Consumer Price Index, monthly, not seasonally adjusted,” Database, accessed 23 July 2026; U.S Energy Information Administration, “Cushing, OK WTI Spot Price FOB,” Database, accessed 23 July 2026; Government of Alberta, “WCS Oil Price,” Database, accessed 23 July 2026.
The retail price of gasoline reflects the costs incurred throughout the supply chain and consists of four components: crude oil prices, refining margins, retail margins and taxes (see Figure 2). This HillNote examines how they affect (unleaded) gasoline prices across Canada and over time.
Figure 2 – Gasoline Supply Chain and Price Components

Descriptive text
The gasoline production process begins with crude oil, which is produced in Canada or imported. Crude oil is transported by pipeline, ship or train to refineries. The gasoline produced at the refineries is then stored and blended with other products, such as ethanol, before being sold from bulk storage terminals to retailers at wholesale prices. Gasoline is then transported by truck to gas stations.
The retail price of gasoline (excluding taxes) is based on the price of crude oil plus the refining margin (wholesale price of gasoline minus the price of crude oil) and the retail margin (retail price excluding taxes minus the wholesale price). Taxes are then added in two steps: fixed municipal, provincial or territorial, and federal gasoline taxes – calculated in cents per litre – are added to the pre-tax retail price. Next, sales taxes, such as the federal Goods and Services Tax, the Harmonized Sales Tax, or the Quebec Sales Tax, are applied last as a percentage of sales. The prices displayed at the pump include all taxes.
Some numbers:
- One-quarter of the crude oil refined in Canada is imported, with the rest produced domestically.
- 94% of the crude oil produced in Canada comes from Western Canada, and the rest is extracted offshore in Newfoundland and Labrador.
- In 2025, 90% of Canada’s crude oil exports were destined for the United States.
- In 2025, the volume of gasoline imported into Canada was only 4.4% of domestic gasoline production.
- Approximately 75 bulk fuel terminals located across Canada supply the major gasoline markets.
- Canada had around 11,500 gas stations at the beginning of 2026.
Sources: Figure prepared by the Library of Parliament, using data obtained from Canada Energy Regulator, Where does Canada’s gasoline come from?, 2019; Statistics Canada, “Table 25-10-0063-01: Supply and disposition of crude oil and equivalent,” Database, accessed 8 June 2026; Statistics Canada, “Table 12-10-0172-01: Canadian international merchandise trade by principal trading partner, and by product section and group, customs-based, annual (x 1,000),” Database, accessed 8 June 2026; Government of Canada, “National Pollutant Release Inventory data search,” Database, accessed 23 July 2026; and Canadian Fuels Association, Fuel Retailing.
Cost of Crude Oil
Crude oil is the primary input in gasoline production and the largest component of gasoline prices, accounting for 45.4% of the average retail price in the first half of 2026. Because crude oil is traded in a global market, prices fluctuate with international supply and demand. While this market has been regulated in the past through government intervention, Canada now takes a market-based approach. Consequently, international economic, geopolitical events and natural disasters can significantly affect crude oil costs.
Although Canada is a net exporter of crude oil, some regions in Canada still rely on imports due to pipeline constraints and the concentration of production in Western Canada. Importing crude oil by marine or rail transportation is often more economical for Atlantic provinces and for some refineries in Quebec, Ontario and British Columbia.
Most of Canada’s crude oil imports in 2025 (74.0%) came from the United States, where production is predominantly light crude. Western Canada, however, primarily produces heavy crude, which trades at a discount because it is more costly to refine (Figure 1). Consequently, crude oil costs vary regionally, with Atlantic provinces generally facing higher costs due to their reliance on imported light crude (see Figure 3).
Refining Margin
The refining margin is the difference between the wholesale gasoline price and the crude oil price. It reflects refinery production costs and profits. Margins fluctuate seasonally, typically widening in the spring when refineries undergo maintenance and operate at reduced capacity while switching production to summer-grade gasoline. Lower output can tighten supply and raise wholesale prices. Margins often remain elevated through the summer due to higher demand before easing in the fall and winter. Summer-grade gasoline is generally more costly to produce because it must meet stricter environmental standards, including vapour pressure requirements.
Regulations can also affect refining costs. Federal Clean Fuel Regulations require producers and importers to reduce fuel carbon intensity, which may require investments in refinery operations. Quebec is the only province with a consumer carbon pricing system, and cap and trade compliance costs are reflected in refining margins.
Refining margins also vary across regions due to market competition, geography, transportation costs and refining capacity. Remote regions face higher distribution costs, contributing to higher margins in Whitehorse (see Figure 3). Additionally, British Columbia has relatively limited refining capacity for its population and relies more on gasoline imports. This reliance can increase wholesale prices at local distribution centres, contributing to some of the highest refining margins in Canada.
Figure 3 – Components of the Retail Price of Gasoline
Alternative Text
Interactive chart showing the breakdown of gasoline prices in Canada, provinces, and selected cities over time. Users can select a market (Canada, provinces or territories, certain cities), a time period between 2018 and 2026, and one or more components of the retail gasoline price. It is therefore possible to show how the price of gasoline has changed over a given period, as well as the proportion of each component in that price.
Note: Values for Canada represent a weighted average based on annual retail sales volumes collected by Kalibrate Canada, Inc., for the following 10 cities: Vancouver, Calgary, Regina, Winnipeg, Toronto, Montreal, Saint John, Halifax, Charlottetown and St. John’s. A volume-weighted average gives more importance to markets that sell more fuel. Values for the provinces represent a simple weighted average of all the cities in the respective province.
This interactive graph is optimized for use on desktop or laptop computers. Display constraints associated with screen size reduce the user experience on devices such as tablets or smartphones.
Source: Figure prepared by Emmanuel Preville, Library of Parliament, using data obtained from Kalibrate, Petroleum price data, “Margin,” Database, accessed 11 June 2026.
Retail Margin
The retail margin is the difference between the retail price (excluding taxes) and the wholesale price paid by the retailer. It reflects operating costs and retailer profits. Retail margins account for the smallest share of the final retail gasoline price, averaging 6.3% in the first half of 2026. Transportation and distribution costs contribute to higher margins in remote regions, such as the territories and Newfoundland and Labrador, where competition is often limited.
To increase profits, many retailers supplement fuel sales with revenue from convenience stores and other amenities, reducing their reliance on fuel sales alone. Retail margins can occasionally be negative when gasoline is sold below cost in response to local market competition, as observed in Chicoutimi and Sault Ste. Marie during the first half of 2026 (see Figure 3).
Taxes
Gasoline taxes are the least volatile component of the pump price but remain a major source of regional price differences. Taxes included in the posted retail price consist of regional fuel taxes, the federal excise tax and sales taxes. Fuel taxes are fixed per-litre charges set by provincial and territorial governments that change infrequently, ranging from 6.2 ¢/L in the Yukon to 19.2 ¢/L in Quebec. Some municipalities also levy additional fuel taxes to fund public transit systems, including Montréal (3 ¢/L), Vancouver (18.5 ¢/L) and Victoria (5.5 ¢/L). Most variation between regions comes from differences in the fixed fuel taxes (see Table 1). By contrast, the federal excise tax is applied at 10 ¢/L nationwide. It was suspended from 20 April 2026 to 31 January 2027. The tax will return at 5 ¢/L from 1 February to 31 March 2027 and to its full rate on 1 April 2027.
Table 1 – Applicable Taxes on Gasoline, by Province, Territory and Certain Municipalities, as of 1 August 2026
| Province/ Territory/ Municipality | Provincial/ Territorial/ Municipal Taxes (¢/L) | Sales Taxes (%) |
| British Columbia | 14.5 | 5 |
| Vancouver | 27 | 5 |
| Victoria | 20 | 5 |
| Alberta | 13 | 5 |
| Saskatchewan | 15 | 5 |
| Manitoba | 12.5 | 5 |
| Ontario | 9 | 13 |
| Quebec | 19.2 | 14.975 |
| Montréal | 22.2 | 14.975 |
| New Brunswick | 10.87 | 15 |
| Nova Scotia | 15.5 | 14 |
| Prince Edward Island | 8.47 | 15 |
| Newfoundland and Labrador | 7.5 | 15 |
| Yukon | 6.2 | 5 |
| Northwest Territories | 10.7 | 5 |
| Nunavut | 6.4 | 5 |
Notes: Vancouver, Victoria and Montréal are the only cities that levy municipal fuel taxes. In Vancouver, the municipal fuel tax (18.50 ¢/L) is offset by lower contributions to the province’s general revenue fund compared with the rest of British Columbia, including Victoria, where the municipal tax is 5.50¢/L. In Quebec, reduced provincial fuel tax rates apply in certain regions, such as those bordering Ontario or New Brunswick.
The Northwest Territories’ fuel tax rate depends on where gasoline is purchased or stored. The fuel tax rate for Zone A (10.7 ¢/L) applies to gasoline purchased or stored on the N.W.T highway system, while the Zone B rate (6.4 ¢/L) applies to gasoline delivered at least 5 km from the highway system. Where the applicable zone is unclear, the Zone A rate is charged by default, and consumers may claim a rebate if the Zone B rate applies.
The federal goods and services tax (GST) of 5% applies in all provinces and territories. In Ontario and the Atlantic provinces, gasoline is subject to the harmonized sales tax (HST), which combines the 5% federal GST with a provincial component. The provincial portion of the HST is 8% in Ontario, 10% in New Brunswick, Prince Edward Island, and Newfoundland and Labrador, and 9% in Nova Scotia. Quebec also applies the Quebec Sales Tax of 9.975% in addition to the federal GST.
Sources: Table prepared by the Library of Parliament using data obtained from British Columbia, Motor fuel tax and carbon tax rates on fuels and substances; Alberta, “Fuel Tax Rates,” Tax, levy, and prescribed interest rates; Saskatchewan, Fuel Tax Licences; Manitoba, Fuel Tax; Ontario, Gasoline tax; Quebec, Fuel Tax Rates; New Brunswick, Gasoline and Motive Fuel Tax – A basic overview of the taxation of gasoline and motive fuel; Nova Scotia, Fuel Tax Program: overview; Prince Edward Island, Gasoline Tax Rates, 30 March 2026; Newfoundland and Labrador, Gasoline Tax; Yukon, Find current tax rates in Yukon; Northwest Territories, Northwest Territories Fuel Tax Rates; and Nunavut, Nunavut Tax Rates, 18 September 2025.
Sales taxes are applied last, on top of the retailer’s price and fixed fuel taxes. The territories do not have a regional sales tax, so gasoline is subject only to the 5.0% federal goods and services tax (GST). In most provinces, gasoline is exempt from provincial sales taxes (PST) leaving the GST as the only sales tax. Provinces that use the harmonized sales tax (HST) apply a higher, combined federal-provincial rate. Quebec also applies its PST, the Quebec sales tax (QST), in addition to the GST, resulting in a higher regional sales tax. Because sales taxes are applied as percentage-based of sales, the amount paid increases with the price of gasoline (see Figure 4).
Figure 4 – Taxes Paid on Gasoline by Region at a Given Retail Gasoline Price (cents per litre)
Alternative Text
Interactive chart showing the estimated share of taxes included in the retail price of fuel. Users enter a specific fuel retail price, and the chart displays the portion of that price that accounts for the regional fuel tax and the sales tax for each province and territory in Canada, as well as the following three cities: Vancouver, Victoria, and Montréal. Thus, for any given retail price, users can see exactly how much is collected for each of these taxes and the total amount of taxes levied per litre of fuel sold, in cents per litre.
Note: The federal excise tax on gasoline is temporarily suspended at 0 ¢/L from 20 April 2026 to 31 January 2027. The tax is scheduled to return to 5 ¢/L on 1 February 2027, and the full 10 ¢/L on 1 April 2027.
This interactive graph is optimized for use on desktop or laptop computers. Display constraints associated with screen size reduce the user experience on devices such as tablets or smartphones.
Sources: Figure prepared by Idir-Amine Metahri and Emmanuel Preville, Library of Parliament, using data obtained from the Government of Canada, Charge and collect the GST/HST; British Columbia, Motor fuel tax and carbon tax rates on fuels and substances; Alberta, “Fuel Tax Rates,” Tax, levy, and prescribed interest rates; Saskatchewan, Fuel Tax Licences; Manitoba, Fuel Tax; Ontario, Gasoline tax; Quebec, Fuel Tax Rates; New Brunswick, Gasoline and Motive Fuel Tax – A basic overview of the taxation of gasoline and motive fuel; Nova Scotia, Fuel Tax Program: overview; Prince Edward Island, Gasoline Tax Rates, 30 March 2026; Newfoundland and Labrador, Gasoline Tax; Yukon, Find current tax rates in Yukon; Northwest Territories, Fuel tax rate; and Nunavut, Nunavut Tax Rates, 18 September 2025.
In the 2024–2025 fiscal year, the federal excise tax on gasoline generated $4.4 billion in revenues (0.9% of federal revenues). Using road motor fuel sales data, GST revenues from gasoline sales were an estimated $3.2 billion in 2024, equivalent to 6.1% of total GST revenues and 0.6% of federal revenues. The excise tax typically generates more revenue than the GST. GST revenues per litre equal the 10 ¢/L federal excise tax only when the final pump price reaches 210 ¢/L. Above this level, GST revenues would exceed excise tax revenues.
Variation of Retail Gasoline Prices Across Canada
Taken together, gasoline markets are highly localized, with substantial regional differences in retail prices (see Figure 5). Structural differences in the four price components mean that some regions consistently face higher prices than others.
Figure 5 – Average Provincial Retail Price of Gasoline and Refinery Locations, 2025
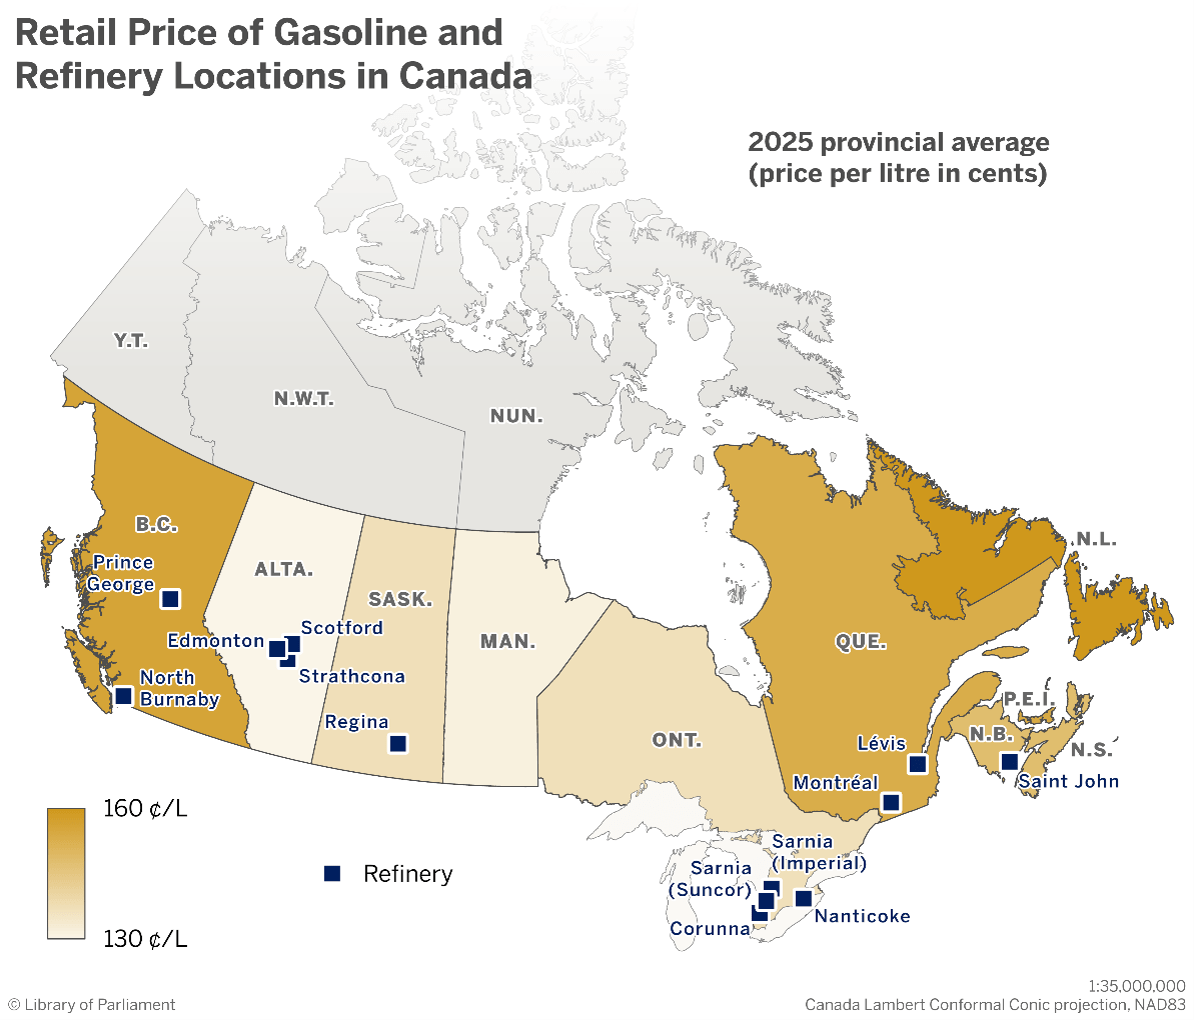
Note: Data for the territories are unavailable.
Sources: Map prepared by Philippe Renaud, Library of Parliament, 2026, using data obtained from Kalibrate, Petroleum price data, “Margin,” Database, accessed 11 June 2026; Natural Resources Canada (NRCan), Refineries – North American Cooperation on Energy Information, 21 November 2017; NRCan, Administrative Boundaries in Canada – CanVec Series – Administrative Features, 1:5M, 1 March 2019; NRCan, Lakes, Rivers and Glaciers in Canada – CanVec Series – Hydrographic Features, 1:5M, 1 March 2019; and NRCan, Wooded Areas, Saturated Soils and Landscape in Canada – CanVec Series – Land Features, 1:5M, 1 March 2019. The following software was used: Esri, ArcGIS Pro, version 3.6.0. Contains information licensed under the Open Government Licence – Canada.
In 2025, Newfoundland and Labrador (157.86 ¢/L) and British Columbia (154. 39¢/L) had the highest average retail price of gasoline, while Alberta (131.83 ¢/L) and Manitoba (133.07 ¢/L) had the lowest, reflecting long-standing regional patterns.
By Megan Barkey, Library of Parliament
Categories: Agriculture, environment, fisheries and natural resources, Business, industry and trade